Amicable Interactive Brokers Data Analysis using Python and R using reticulate
In this post, I will demonstrate through an example the immense joy of working with both R and Python using reticulate!
First a little on the background, the discussion and arguments on R vs. Python are endless, vehement and quite misleading. As a pragmatic practitioner (euphemism for not being good at anything :-) ), I firmly believe in getting things done through the path of least resistance.
I have invested a lot of effort in learning R and I simply enjoy working in the simplicity it offers. IMHO, R is one of the best and simplistic data analysis tools out there!
Clearly, in my experience, R falls short in complicated programming tasks like scraping, intensive looping, handling non-traditional data sources, etc. To be clear, there are packages to simplify the process in R (but, it just feels hacky! and more importantly unmaintainable).
My interest in reticulate and bridging R and Python came from this problem I encountered.
I have used the IBrokers package to gather data from my Interactive Brokers Trade Workstation to perform option analysis for trading. As the post mentions, Interactive Brokers has upgraded their packages quite regularly, while IBrokers hasn't kept up with those updates and relies on a rather old API (9.64) from Interactive Brokers. The latest version is TWS API v9.72+ and it exposes quite a few features and functionalities.
My options analysis is limited to End-Of-Day analysis and high frequency timing isn't of much use for my current trading strategies. Interactive Brokers has recently (I believe a year back) started charging for real-time market data (quite fairly in my opinion). However, TWS API v9.72+: Delayed Streaming Data continues to be free. Frankly, this is a quite friendly gesture from Interactive Brokers and I truly appreciate it!
Now, IBrokers has a wonderful API to the Interactive Brokers Trade Workstation and significantly equips me for algorithmic trading and portfolio mangement. Despite, using the old API, most trading related functionalities continue to work seamlessly (for my purposes).
The significant missing link is the data! Unable to have data acess through R, I decided to look for Python alternatives. I am a novice at Python but have been amazed by the Python eco-system and the wonderful open source packages available for common use. I was excited to find the erdewit/ib_insync: Python sync/async framework for Interactive Brokers API. ib_insync is under active develoment and I've been very happy with using it through the reticulate bridge from R.
The below code shows how simple and easy it is to import Delayed Market Data in R using the Interactive Brokers Trade Workstation through ib_insync
The following python code Get-IB-Options-Data.py is sufficient to get the delayed market data:
# Get IB Data using python

import pandas as pd
from ib_insync import *
from iteration_utilities import grouper
from datetime import *

ib = IB()

class MyOptionsDataTable:

    def __init__(self, *contracts):
        self.df = pd.DataFrame(columns='symbol expiry strike right bidSize bid ask askSize last lastSize volume high low close underlying timestamp'.split())
        self.df['symbol'] = [c.localSymbol for c in contracts]
        self.contract2Row = {c: i for (i, c) in enumerate(contracts)}

    def getOptionsData(self, contracts, undPrice):
        for group in grouper(contracts, 50):
          tickers = ib.reqTickers(*group)

          for t in tickers:
              row = self.contract2Row[t.contract]

              self.df.iloc[row, 1:] = (t.contract.lastTradeDateOrContractMonth, t.contract.strike, t.contract.right, t.bidSize, t.bid, t.ask, t.askSize, t.last, t.lastSize, t.volume, t.high, t.low, t.close, undPrice, t.time)

          ib.sleep(10)

        ib.disconnect()

        return self.df


def read_options_data(s = "FB", e = "SMART", c = "USD"):

  ib.connect('127.0.0.1', 7496, clientId=3)
  ib.reqMarketDataType(3)

  stock = Stock(s, exchange=e, currency=c)
  ib.qualifyContracts(stock)

  [ticker] = ib.reqTickers(stock)

  # Underlying price
  undPrice = ticker.last

  option = Option(s, exchange=e)
  cds = ib.reqContractDetails(option)
  contracts = [cd.summary for cd in cds]


  table = MyOptionsDataTable(*contracts)
  data = table.getOptionsData(contracts, undPrice)
  data['ts'] = pd.to_datetime(data['timestamp'])
  data['ts'] = pd.to_numeric(data['ts'])

  return data
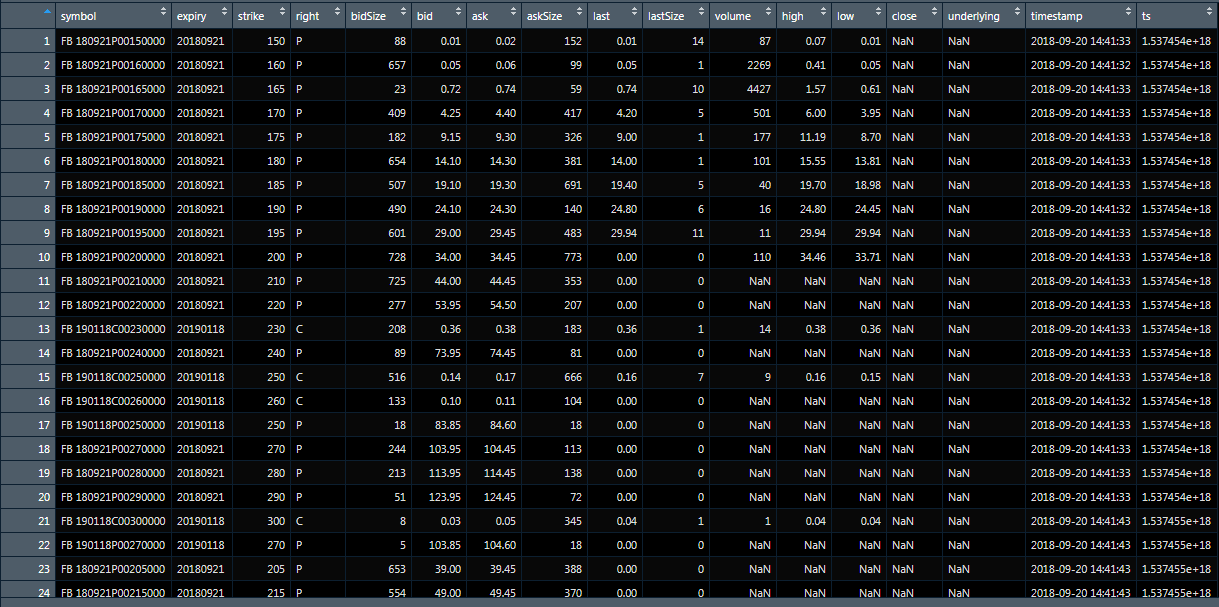
The following r code uses reticulate to get data using the python bridge. In this ode I am extracting a snapshot of all the Facebook options being traded! This takes a little time!
start <- Sys.time()

# Get IB Data using reticulate

library(reticulate)
use_python("/home/ghost/anaconda3/bin/python")
use_condaenv("ibPy")

source_python("./r-project/Models/Clean/Get-IB-Options-Data.py")
df <- read_options_data(s="FB",e="SMART",c="USD")

#print(df)

require("data.table")
dt <- as.data.table(df)
dt <- dt[!is.na(bid)]

# Credit:https://stackoverflow.com/a/13456338/644081
require("anytime")
anytime:::setTZ("UTC") #This is consistent with the way IB returns data
dt[,timestamp:=anytime(ts/1e9)]

dt <- dt[!is.na(bid)][!bid==-1]
dt[,symbol:=(as.character(symbol))]
dt[,expiry:=(as.character(expiry))]
dt[,right:=(as.character(right))]

dt[,strike:=as.numeric(as.character(strike))]
dt[,bidSize:=as.numeric(as.character(bidSize))]
dt[,bid:=as.numeric(as.character(bid))]
dt[,ask:=as.numeric(as.character(ask))]
dt[,askSize:=as.numeric(as.character(askSize))]
dt[,last:=as.numeric(as.character(last))]
dt[,lastSize:=as.numeric(as.character(lastSize))]
dt[,volume:=as.numeric(as.character(volume))]
dt[,high:=as.numeric(as.character(high))]
dt[,low:=as.numeric(as.character(low))]
dt[,close:=as.numeric(as.character(close))]
dt[,underlying:=as.numeric(as.character(underlying))]

dt[order(volume, decreasing = TRUE)]
# os <- import("os")
# os$getcwd()

end <- Sys.time()

print(paste0("Start time is: ", start))
print(paste0("End time is: ", end))
print(paste0("Time taken is: ", end - start))
The R code acutally uses the python exectuable and my virtual environment ibPy to make things work like magic! How sweet is that!
The following were the steps I believe to creating the virtual environment
Create a virtual env using conda create -n ibPy
Activate the virtual env conda activate ibPy
Download the IBAPI from Interactive Brokers - API Software and go to /twsapi_macunix.973.07.zip Folder/IBJts/source/pythonclient
Install the API using python setup.py install
I also used a few additional packages the can be installed using:
```py
pip install iteration_utilities
```
That's it! Watch the magic happen! :-)
BTW ... I highly recommend Interactive Brokers for retail traders! Awesome brokerage!