Creating a surface plot using Plotly
Just stumbled on this beautiful Surface plot that can be made using plotly
The code is fairly straight forward.
library(plotly)
# volcano is a numeric matrix that ships with R
plot_ly(z = volcano, type = "surface")
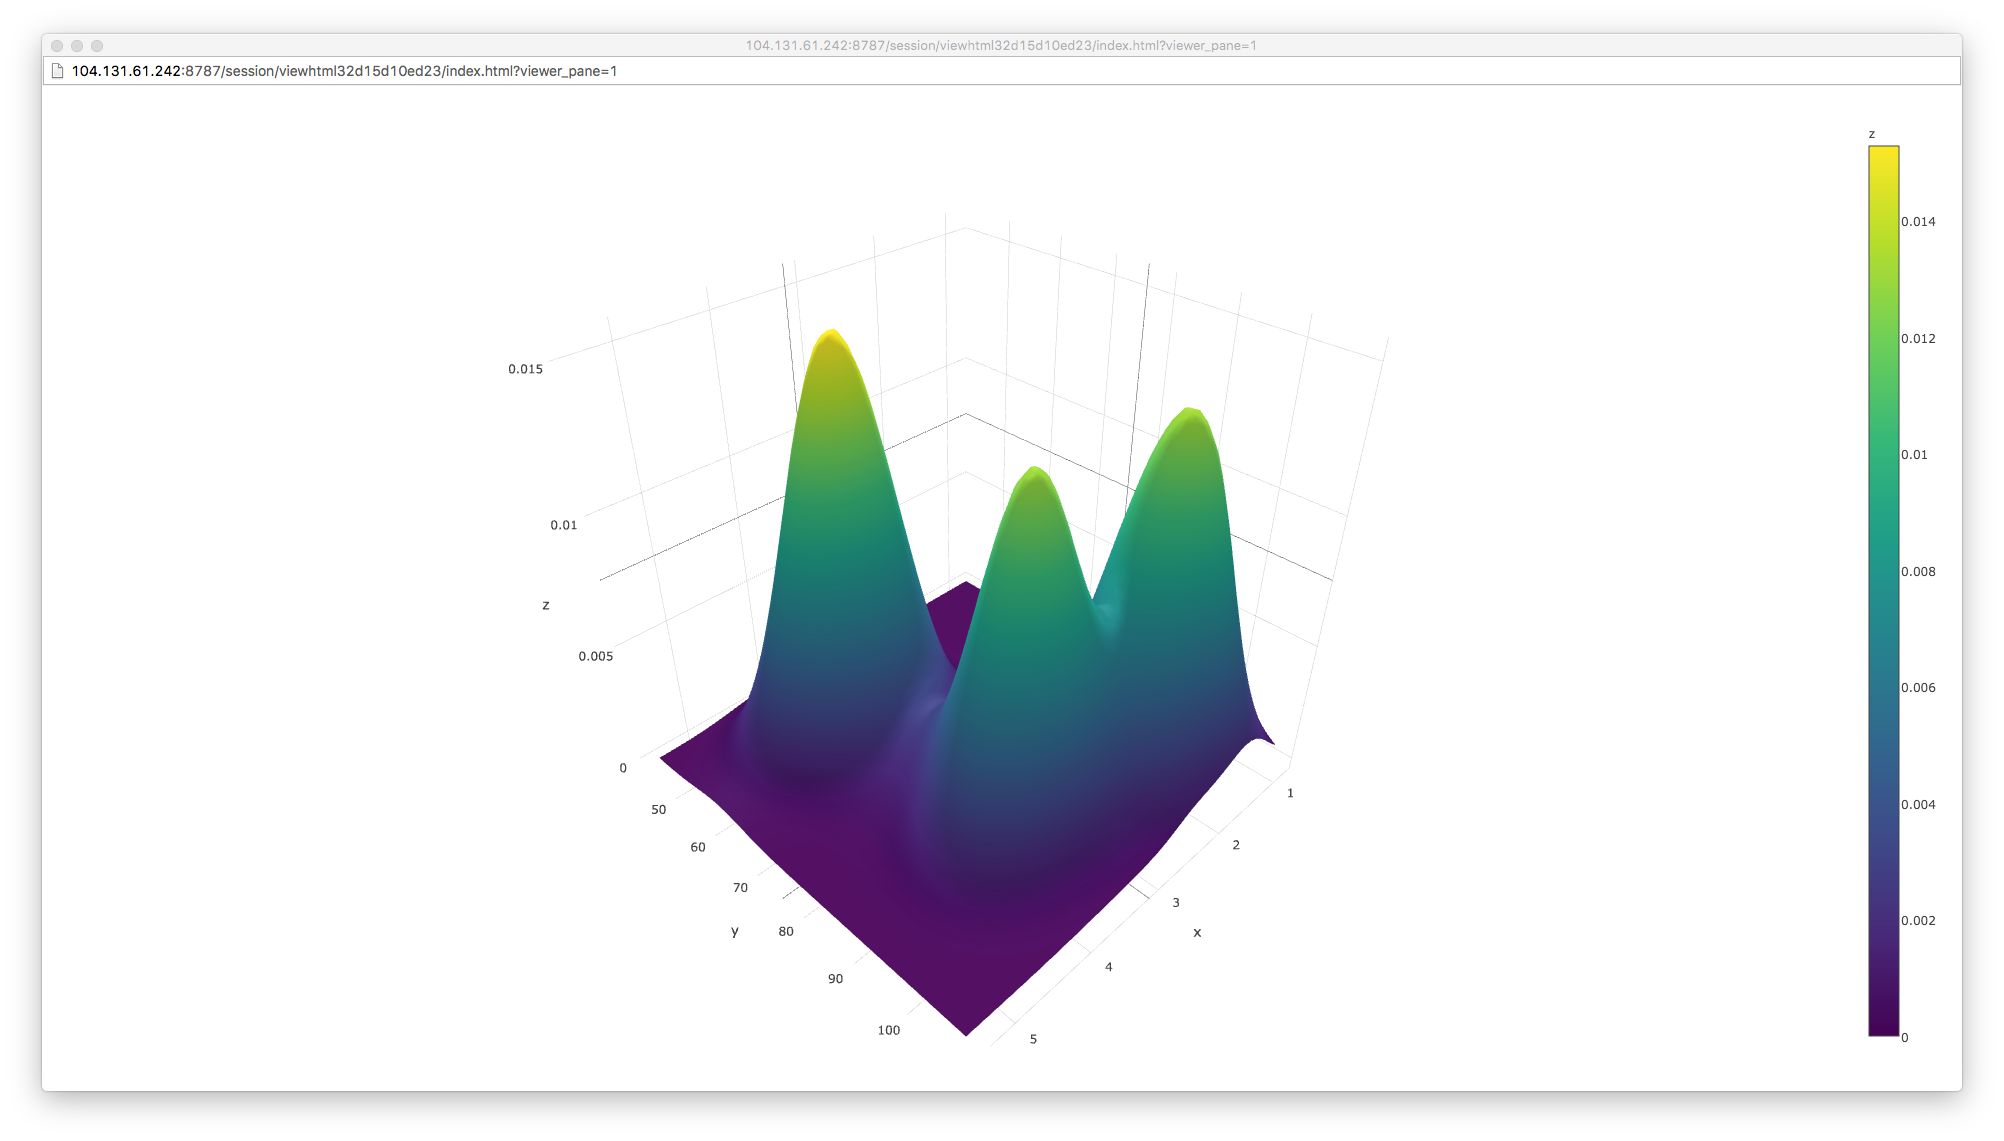
kd <- with(MASS::geyser, MASS::kde2d(duration, waiting, n = 50))
with(kd, plot_ly(x = x, y = y, z = z, type = "surface"))
The output is this cool interactive chart!