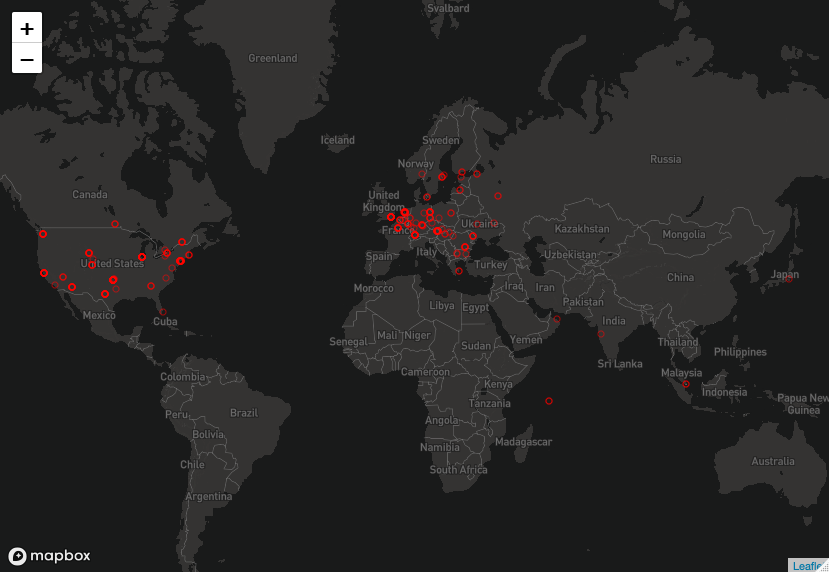
Visualization of Tor Servers using IPinfo data
Here is a visualization of Tor Servers after ~ 3000 rotations using @ipinfoio and @Mapbox
rstats #privacy #anonymity #anonymous #dataprivacy #visualization
Europe beats US ... but then strangely Russia isn’t quite in the action there!
Get data from here
Use this data and modify the code below. Should be much simpler!
The visualization after a bit of data munging can be done using the below R code! Get your own Mapbox key from Mapbox
setwd("~/Dropbox/pandora/My-Projects/repos/diary/writing/data/ipinfo/")
output <- "consolidated-ipinfo.txt"

require(jsonlite)
require(data.table)
require(tidyverse)
# dt <- read_json(output)

d.o <- fromJSON(output)
d.o$sno <- rownames(d.o)

d <- tibble(d.o,.name_repair = "universal")
d

data <- d$d.o %>% select(ip,loc,sno)
data_dt <- as.data.table(data)


data_dt[,lat:=str_split_fixed(loc,",",n = 2)[1],by=sno]
data_dt[,long:=str_split_fixed(loc,",",n = 2)[2],by=sno]

data_dt <- unique(data_dt[,list(ip, lat,long)])

data_dt[,lat:=as.numeric(lat)]
data_dt[,long:=as.numeric(long)]

write_delim(data_dt,"tor-data.csv",col_names = TRUE)

# if (!requireNamespace("remotes"))
#   install.packages("remotes")
#
# remotes::install_github("rstudio/renv")

# install mapbox
# devtools::install_github("rstudio/leaflet.mapboxgl")
# https://github.com/rstudio/leaflet.mapboxgl

# config
# [Managing secrets](https://cran.r-project.org/web/packages/httr/vignettes/secrets.html)
install.packages("config")


options(mapbox.accessToken = config::get("mapbox")$accessToken)

library(leaflet)
library(leaflet.mapboxgl)

leaflet(data_dt) %>%
  addMapboxGL(style = "mapbox://styles/mapbox/dark-v10") %>%
  addCircleMarkers(weight = 1, fillOpacity = 0, radius = 3, color = "red")


# Mapbox styles : [Examples | Mapbox GL JS | Mapbox](https://docs.mapbox.com/mapbox-gl-js/examples/)