Shiny Server on Ubuntu
Install Shiny Server on ubuntu following the instructions here.
- Install rbase
sudo apt-get install r-base
- Install shiny R package
sudo su - \ -c "R -e \"install.packages('shiny', repos='https://cran.rstudio.com/')\""
- Install Shiny Server
sudo apt-get install gdebi-core
wget https://download3.rstudio.org/ubuntu-12.04/x86_64/shiny-server-1.5.4.869-amd64.deb
sudo gdebi shiny-server-1.5.4.869-amd64.deb
Check status of Shiny Server
Check the status of Shiny Server as mentioned here
sudo systemctl status shiny-server
Starting Shiny Server at startup
sudo systemctl enable shiny-server
Configure Shiny Server
Shiny Server configuration is mentioned here
The default configuration file resides at **/etc/shiny-server/shiny-server.conf** and can be modified to suit ones needs.
Modify the config to as needed: Below is mine. Don't forget to restart using sudo systemctl restart shiny-server
My shiny-server.conf
# Instruct Shiny Server to run applications as the user "shiny"
run_as shiny;

# Define a server that listens on port 3838
server {
  listen 3838;
  run_as ghost;
  # Define a location at the base URL
  location / {

    # Host the directory of Shiny Apps stored in this directory
    site_dir /srv/shiny-server;

    # Log all Shiny output to files in this directory
    log_dir /var/log/shiny-server;

    # When a user visits the base URL rather than a particular application,
    # an index of the applications available in this directory will be shown.
    directory_index on;
  }
}
Note: I run the server as the user ghost
Also, I changed the ownership of the serving directory using: sudo chown $USER:$USER -R /srv/shiny-server/
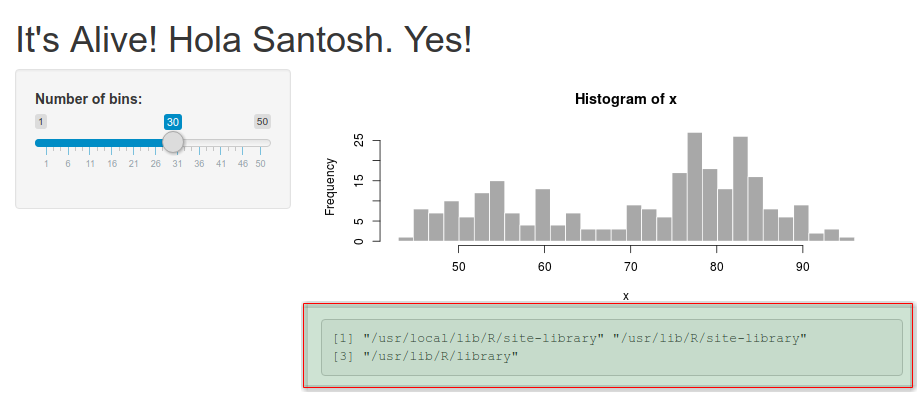
I modified the hello sample app to check below libpath directories! As you can see shiny now utilizes my standard installed libraries from my user!
Modifed ui.R
library(shiny)

# Define UI for application that plots random distributions
shinyUI(pageWithSidebar(

  # Application title
  headerPanel("It's Alive! Hola Santosh. Yes!"),

  # Sidebar with a slider input for number of observations
  sidebarPanel(
    sliderInput("bins",
                  "Number of bins:",
                  min = 1,
                  max = 50,
                  value = 30)
  ),

  # Show a plot of the generated distribution
  mainPanel(
    plotOutput("distPlot", height=250),

    verbatimTextOutput("summary") #ADDED
  )
))
Modifed server.R
library(shiny)

# Define server logic required to draw a histogram
shinyServer(function(input, output) {

  # Expression that generates a histogram. The expression is
  # wrapped in a call to renderPlot to indicate that:
  #
  #  1) It is "reactive" and therefore should be automatically
  #     re-executed when inputs change
  #  2) Its output type is a plot

  output$distPlot <- renderPlot({
    x    <- faithful[, 2]  # Old Faithful Geyser data
    bins <- seq(min(x), max(x), length.out = input$bins + 1)

    # draw the histogram with the specified number of bins
    hist(x, breaks = bins, col = 'darkgray', border = 'white')
  })

  #ADDED
  output$summary <- renderPrint({
    .libPaths()
  })

})
Here is the output of my local app (http://shiny.santoshsrinivas.loc/sample-apps/hello/). Note - I setup the /etc/hosts and nginx to setup my local site!