US State Level Choropleth using FHFA HPI Data
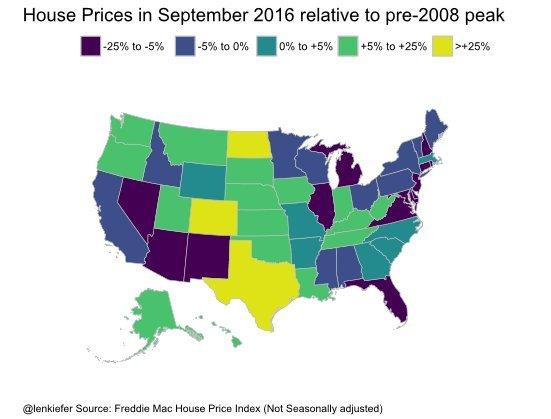
My LinkedIn News (spam?) feed just flashed an interesting choropleth of housing price changes across states (House Prices in Sep 2016 relative to pre-2008 peak)
I'll try to replicate something similar using FHFA data available here
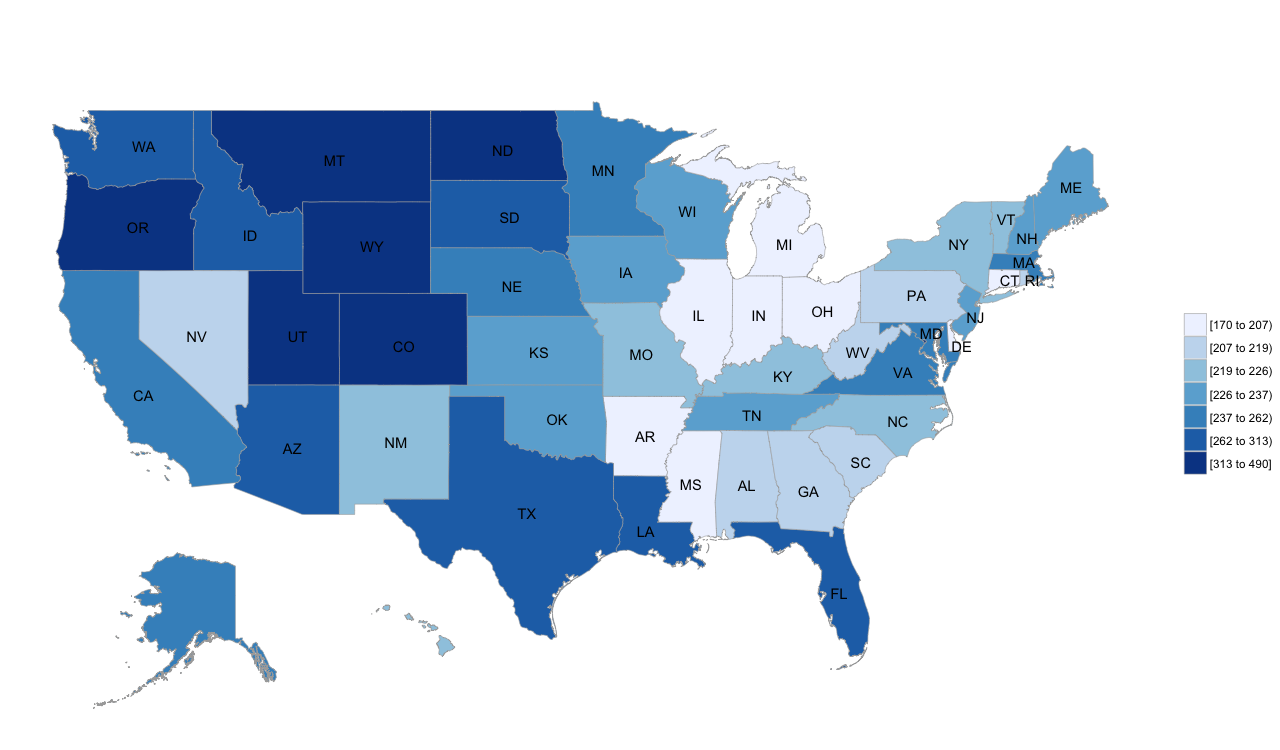
For ease, I'm actually plotting the Price Index itself for Q3-2016 for purchase-only transactions. choroplethr & choroplethrMaps are the packages that make this job really easy!
I use stringdist for some fuzzy matching to cater to the package requirements. Yeah! My sweet little AI tool! :-) ... any it actually works perfectly! ;-)
Here is the output and it is amazing to be able to produce such a neat graphic with so little code!
TODO: I'll revisit this for a lot of analysis that can done from this wealth of information as I find time
Here is the code!
require("data.table")
dt <- fread("data/HPI_master.csv")


# Let us get the state level data for purchase-only transactions
dt <- dt[yr==2016][level=="State"][period == 3][hpi_flavor == "purchase-only"]

# Credit: https://cran.r-project.org/web/packages/choroplethr/vignettes/b-state-choropleth.html
library(choroplethr)
library(choroplethrMaps)

# install.packages('stringdist')
require("stringdist")
standard_states <- state.regions$region
dt[,state_num:=amatch(place_name, standard_states, maxDist = 5)]

dt[,state_final:=standard_states[state_num]]
dt[,region:=state_final]
dt[,value:=as.numeric(index_nsa)]
state_choropleth(dt)