How Much do you Need to Earn to Afford a Modest Apartment in Your State?

. 1 min read

Continuing with the theme of plotting Choropleths, here is an interesting problem I encountered. The details are below, but the end product is to develop a static visualization as shown here ... Out Of Reach: National Low Income Housing Coalition.

I recently came across a common problem of visualizing simple state level data captured in PDFs as a choropleth. The data is from the following well researched report on housing data

I need the data extracted from the following PDF page imaged below.

2015 STATES RANKED BY TWO-BEDROOM HOUSING WAGE

I found that tabulapdf/tabula works quite well in extracting data. Yeah! Even on a windows machine!

Now, that we have got the data, let us create the state choropleth.

Making basic state level Choropleths is a breeze using CRAN - Package choroplethr available at trulia/choroplethr

Creating state level choropleths is well explained here and it is easy and cool!

However, here is the interesting problem. The data in state.regions does not match exactly with the dataset we have at hand.

So, instead of correcting the data so that it matches manually, let us try to use a algorithmic approach.

The R packages that seem to be available to accomplish this task are:

Replacing patterns in the data worked quite well using gsub explained here.

Using fuzzy matching, I was able match all the states using this pretty neat R code.

require("stringdist")

dt[,state_num:=amatch(State1, standard_states, maxDist = 5)]
dt[,state_final:=standard_states[state_num]]
dt[,region:=state_final]

With those changes, the final map is shown below.
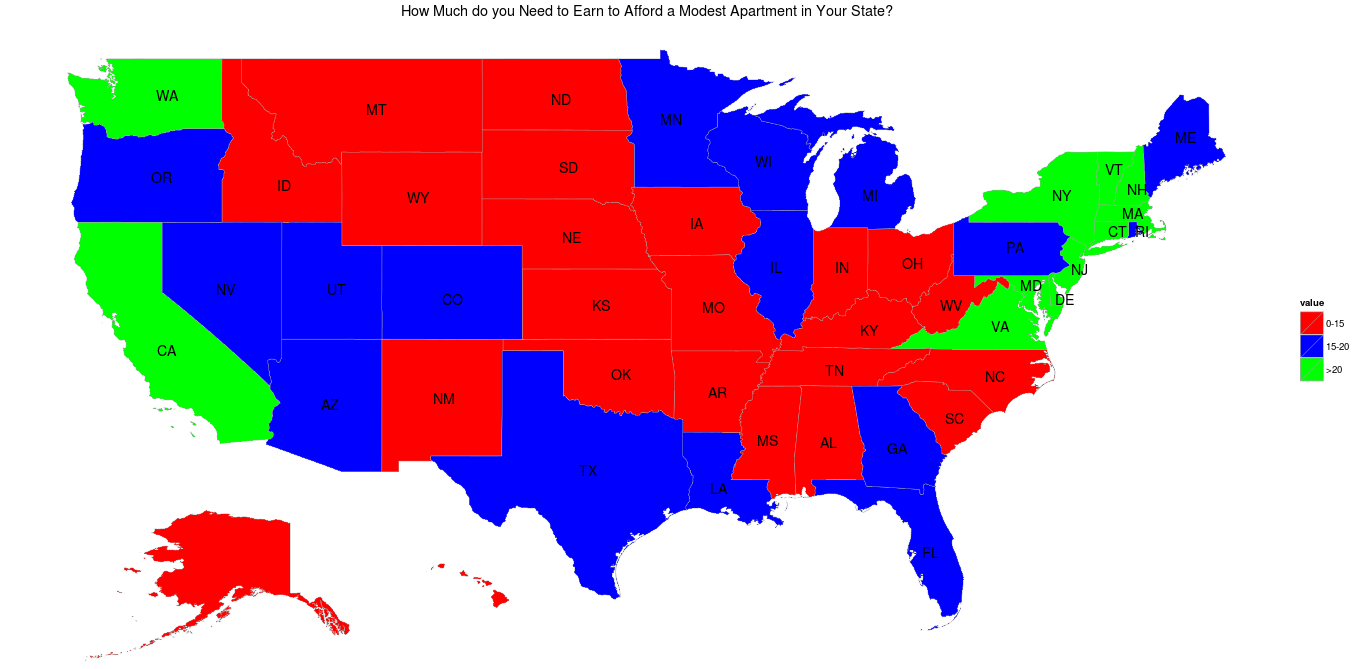
How Much do you Need to Earn to Afford a Modest Apartment in Your State?


Tags

AWS Analytics Antifragile Apache Spark Apple Apps Arbitrage Automation Awesome BBMP Bangalore Black Swan Bonds Boonex Bootstrap Brokerage Charges CFPB CMS CSS Calypso Camelot Capital Markets Charts Chirp Choropleth Chrome Code Igniter Collections Containerization Converters Cycling DalalBeat Data Analytics Data Journalism Data Mining Data Munging Data Privacy Data Science Databases Debt Design Design Stock DesignStock Diet Django Docker Document Processing Dropbox Electron Electronics Entertainment Entrepreneurship Exercise FFMPEG Facebook Finance Fire TV Stick Fitness Forerunner From-The-News Fun Futures Gaana Garmin General Geocoding Getting Started Ghost Google APIs GraphicsMagick HHVM HTTPS Hackathon Hacks Hardware Health House Keeping Housing IBM BlueMix IBrokers IPinfo Ideas Image Conversion Image Processing Infographics Interactive Brokers Internet Investing IoT Legal Lets Encrypt Mac Machine Learning Mailbox app Mapbox Markdown Marketing Meteor Mockups MongoDB Mortgages Movies Music MyPad MySQL Nativefier Nature Netflix Newsletters Nginx Node.js Notes OCR OSX Open Source OpenCPU Options PDF PHP Pebble Peloton Personal Photography Picture Platforms Plex Portable Apps Productivity Property Tax PyroCMS Quantitative Finance R-Project Random Raspberry Pi Research Resources Reticulate Robot S3 SQLite STT Scraping Security Server Shell Shiny Side Project Sikuli Speech Recognition Spider Pro Spinning Spotify Startup Resources Startups Strategy Sublime Text System Monitoring Tax Terminal Tips To Do Tools Torrent Trading Trends Troubleshooting USElection2016 Ubuntu Unix Valuations Video Conversion Visualization Wagtail Wearables Weekend Fun WhatsApp Wordpress anaconda annie bash catalina cv2 daily coding dailycoding data.table debugging devtools downloader e-Signatures ggplot git go google maps hat-tip iOS iPad iPhone iTunes javascript jupyter logging macos numpy opencv optionality plotly python rstats videos youtube