Plotting Geocoded points on the US Map
I recently had to plot a set of geocoded points on the US Map. The ease with which we can create maps using custom data that can be transformed using GeoCoding APIs is quite amazing.
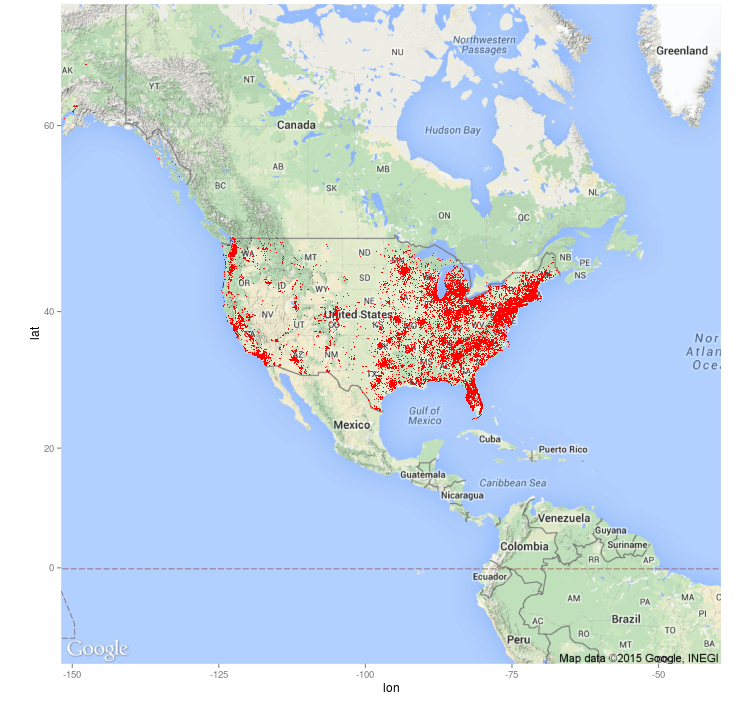
Here is a visualisation of almost 60,000 geocoded data points on a US map. The color and aesthetics are fully controllable. Even a simple basic effort looks quite good as shown below.
I used dkahle/ggmap to create the map using the data from my custom geocoding scripts that leverage Google's geocoding service to arrive at quite accurate results.