Bullet Graphs using R
I came across this library for creating Bullet graphs using R.
Installation of the package is straightforward:
library(devtools)
install_github(c('rstudio/htmltools',
              'ramnathv/htmlwidgets',
              'sipemu/d3Dashboard'))
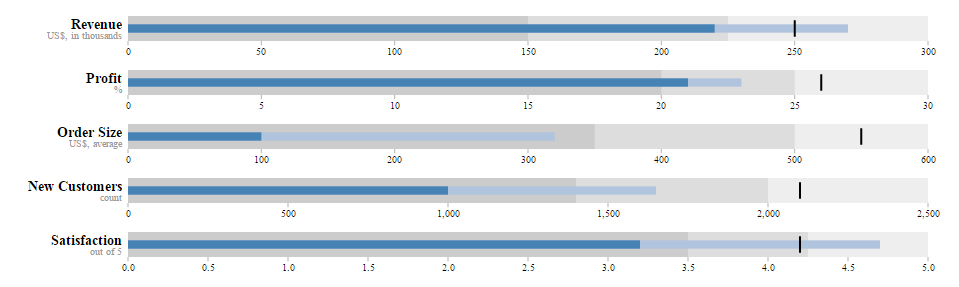
The example bullet graph can be created as follows:
require("d3Dashboard")

ytd2005 <- list(
  title=list("Revenue", "Profit", "Order Size", "New Customers", "Satisfaction"),
  subtitle=list("US$, in thousands", "%", "US$, average", "count", "out of 5"),
  range=list(c(150, 225, 300),
             c(20, 25, 30),
             c(350, 500, 600),
             c(1400, 2000, 2500),
             c(3.5, 4.25, 5)),
  measures=list(c(220, 270),
                c(21, 23),
                c(100, 320),
                c(1000, 1650),
                c(3.2, 4.7)),
  markers=list(250, 26, 550, 2100, 4.2)
)

# Plot
bulletGraph(ytd2005)
After reading the wiki, it is interesting about the information that can be gleaned from the bullet graph.
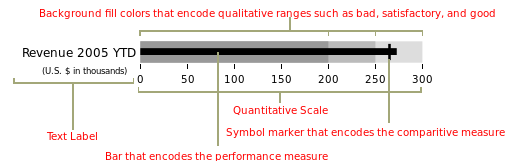
- The dark center line represents the actual value.
- The dark vertical line represents a target value.
- The colored bands represent ranges, such as poor, average, and good.