Creating an Organization Chart using R
I needed an "Organization Chart" (all the hierarchy yadda yadda) for an application to the government. The typical procedure would be to use Microsoft Visio or Powerpoint. But, I hate all those clicks, dragging around the boxes, maintaining consistency among the boxes etc.
So, I decided to try doing this with R. That's where DiagrammeR comes to the rescue. Reading through the docs a bit, I was able to quickly generate an Org Chart with all the flexibility I needed!!!
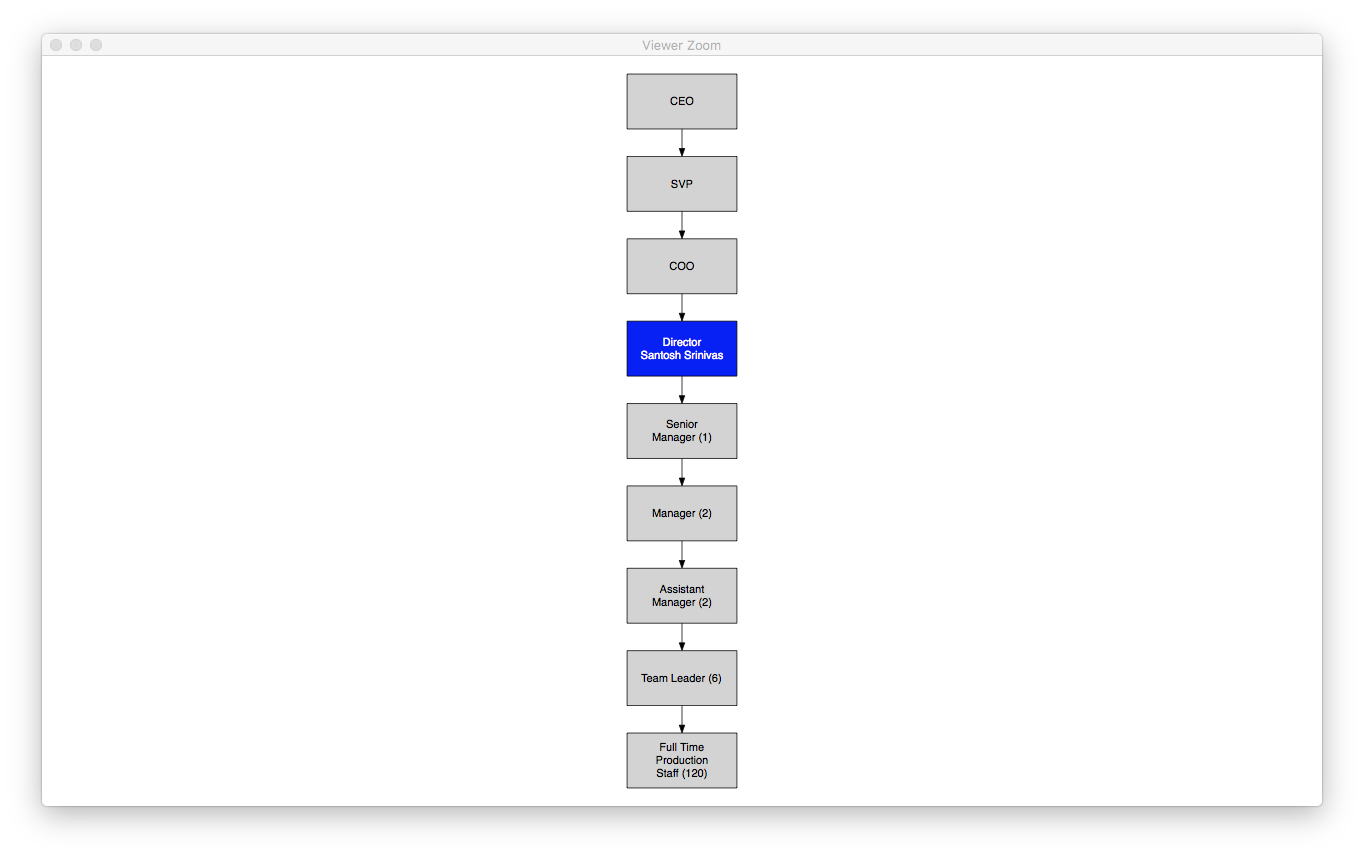
Here is the chart and the code below! .. Looks Cool? ;-)
require("DiagrammeR")

# Credit: http://rich-iannone.github.io/DiagrammeR/graphviz_and_mermaid.html#arrow-shapes

grViz("
digraph boxes_and_circles {
	# a 'graph' statement
	graph [overlap = true, fontsize = 10]

	# several 'node' statements
	node [	shape = box,
			fixedsize = true,
			style = filled,
			width = 2,
			height = 1,
	    	fontname = Helvetica]
	CEO; SVP; COO; Director [fillcolor = blue, label = 'Director \n Santosh Srinivas', fontcolor = white]; SrManager [label = 'Senior \n Manager (1)']; Manager [label = 'Manager (2)']; AM [label = 'Assistant \n Manager (2)']; TL [label = 'Team Leader (6)']; FTE [label = 'Full Time \n Production \n Staff (120)']

	# several 'edge' statements
	CEO->SVP SVP->COO COO->Director Director->SrManager SrManager->Manager
	Manager->AM AM->TL TL->FTE
}
")
Generated using file create-org-structure-using-diagrammer-Altisource.R